
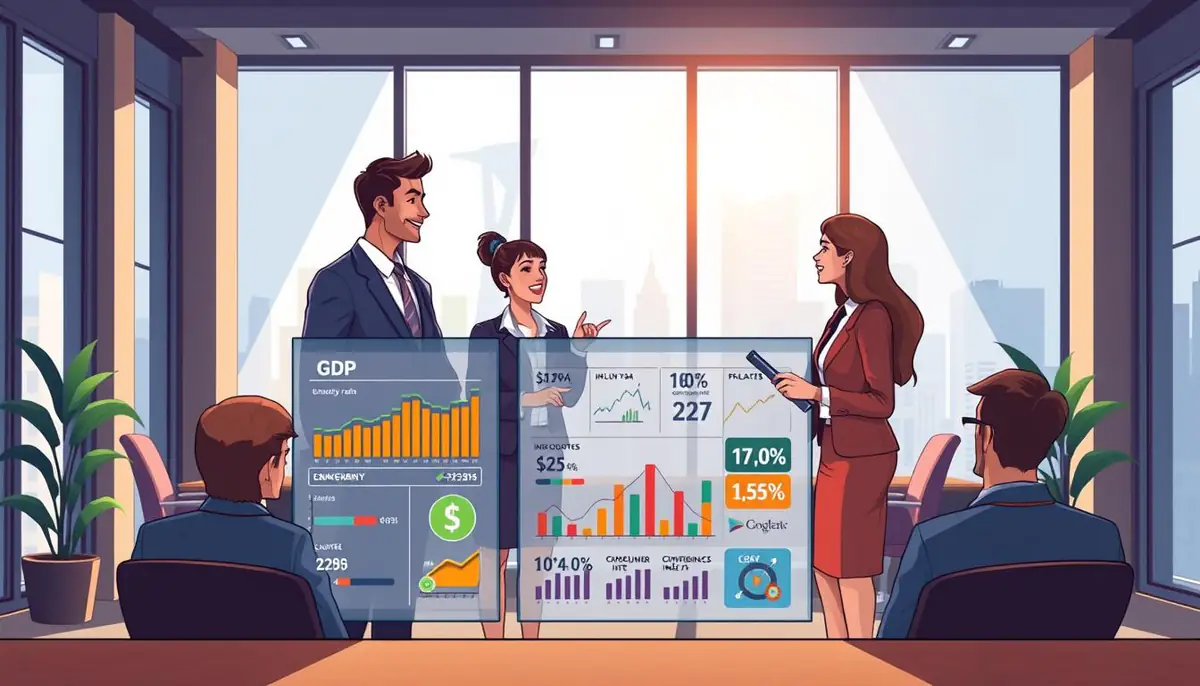
Understanding the health of the United States market can feel like learning a new language. Whether you are a worker, a homeowner, or an investor, these data points shape your daily life. Learning economic indicators for beginners provides the tools needed to navigate financial news with confidence.
These metrics track vital areas like gross domestic product, inflation, and job growth. They also cover interest rates, consumer spending, and housing trends. No single release tells the entire story of the nation, as different reports often move in opposite directions.
By watching these trends, you gain a clearer picture of where the country is heading. You will learn how to interpret complex data to make smarter decisions about your money and career. This guide breaks down the most important numbers so you can stay informed without needing a degree in finance.
How to Read Economic Indicators Without Getting Overwhelmed
Understanding the economy is easy. You don’t need a finance degree. Just break down economic data into simple parts. This way, you can see how the country is doing.
Start with the question each indicator answers
Every report has its own story. Some economic indicators show how much we produce. Others talk about living costs or jobs. When you see a headline, think if it’s about making things, prices, jobs, or how people feel.
Separate economic conditions from market reactions
It’s key to know the real economy from what investors think. Markets can react based on what they hoped for, not just the numbers. Even if growth is up, if people expected more, the market might still fall.
Compare trends instead of relying on one monthly release
One month’s data is not enough. Economic changes take time. Look at data over three or six months. This way, you avoid false conclusions from short-term changes.
Use percentages, dollar amounts, and index points correctly
Reports use different ways to show data. You can’t compare job changes to retail sales directly. Knowing these helps you understand the data right.
| Data Type | What It Measures | Common Example |
|---|---|---|
| Percentage | Rate of change | Unemployment rate |
| Dollar Amount | Total value | Retail sales |
| Index Points | Relative level | Consumer confidence |
Step 1: Understand What Gross Domestic Product Measures
Gross Domestic Product is like a report card for the U.S. economy. It shows the total value of all goods and services made in the country. This helps economists see how well the nation is doing.
Define GDP in terms of goods and services produced in the United States
GDP is like a big list of everything made in the U.S. It includes things like haircuts and new cars. It only counts the final product, not the parts used to make it. This way, we get a true idea of what’s added to the economy.
Break GDP into consumer spending, business investment, government spending, and net exports
Economists split Gross Domestic Product into four parts to understand growth. Consumer spending is the biggest part, showing what families buy. Business investment, government spending, and net exports also play a role.
| Component | Description | Economic Impact |
|---|---|---|
| Consumer Spending | Household purchases | High impact |
| Business Investment | Equipment and structures | Growth driver |
| Government Spending | Public services and defense | Stability factor |
| Net Exports | Exports minus imports | Global balance |
Distinguish real GDP from nominal GDP
It’s important to know the difference between real GDP and nominal GDP. Nominal GDP uses today’s prices, but can be misleading with inflation. Real GDP adjusts for prices, showing if we’re really making more or just charging more.
Why quarterly GDP estimates can be revised
At first, the government gives out estimates that might change later. This is because early data is not complete. As more information comes in, the numbers get better, giving a clearer picture.
Use GDP growth to judge expansion and contraction
When GDP grows, it means the economy is doing well. It usually means more jobs and higher pay. But if GDP goes down, it might mean trouble ahead. Looking at trends helps us see if things are getting better or worse.
Step 2: Use Inflation Numbers to Track Changing Prices
Inflation quietly changes the value of your money. When prices go up, you can buy less with the same money. It’s important to watch these changes to see how the economy affects your life.
Learn what the Consumer Price Index measures
The Consumer Price Index, or CPI, is a key tool for tracking price changes. It looks at the average price change for a set of goods and services. This includes things like food, gas, rent, and medical care.
Compare headline inflation with core inflation
There are two main ways to see the inflation rate. Headline inflation looks at all prices, including food and energy. Core inflation removes these to show the real price trend.
Understand the difference between inflation, deflation, and disinflation
It’s good to know the difference between these terms. Each shows a different price change:
- Inflation: Prices go up, and money buys less.
- Deflation: Prices fall, and money buys more.
- Disinflation: The inflation rate slows down.
Why the personal consumption expenditures price index matters
The PCE price index is important, especially to the Federal Reserve. It’s seen as more complete because it looks at how people change their spending habits when prices rise.
Interpret inflation as a change in purchasing power
Think of inflation as a measure of your purchasing power. If your income doesn’t keep up with inflation, your standard of living might drop. Watching the Consumer Price Index helps you plan for the future and manage your budget.
Step 3: Read Employment and Unemployment Data
The monthly jobs report shows how many Americans are working. It helps us see if the economy is growing or slowing. By looking at this data, we can understand if businesses are hiring and if families are doing well.
Understand the monthly jobs report from the Bureau of Labor Statistics
The Bureau of Labor Statistics, or BLS, releases a jobs report every first Friday. This report has two surveys: one for households and one for businesses. Together, they give us a full view of the national labor market.
Compare payroll growth with the unemployment rate
Payroll growth shows how many new jobs employers add. The unemployment rate shows the percentage of people looking for work but can’t find it. It’s key to look at both to understand the job market fully.
- Payroll growth: Shows business demand for new workers.
- Unemployment rate: Shows the availability of workers compared to job openings.
Define labor-force participation and the employment-population ratio
Economists look at the labor-force participation rate to see who’s working or looking for work. The employment-population ratio shows how many of the working-age population are employed. These numbers give us more insight than just the headline numbers.
Recognize why discouraged workers may not appear in the unemployment rate
The official unemployment rate only counts those actively looking for a job. If someone stops looking because they feel discouraged, they’re not counted. This can make the rate seem better than it really is.
| Metric | What it Measures | Economic Signal |
|---|---|---|
| Payroll Growth | New hires | Business expansion |
| Participation Rate | Active workforce | Labor supply |
| Wage Growth | Pay increases | Consumer purchasing power |
Use wage growth and hours worked to assess job-market strength
A strong jobs report is more than just new jobs. We look at average hourly earnings and hours worked. Rising wages and steady hours mean the labor market is strong and workers have more money to spend.
Step 4: Follow Interest Rates and Federal Reserve Decisions
Interest rates are key to the U.S. economy. They affect your savings and mortgages. Watching these changes helps you understand money’s flow in the country.
Identify the federal funds rate as the main policy rate
The federal funds rate is what banks charge each other for overnight loans. It’s the base of the U.S. financial system. Changes in this rate mean changes in money costs across the economy.
See how rate changes affect borrowing and saving
When the Federal Reserve changes this rate, it affects your money. Higher rates make borrowing more costly. This can slow spending. Lower rates encourage borrowing and investment, boosting the economy.
Understand the Federal Reserve’s employment and price-stability goals
The central bank has two main goals. It aims for full employment and stable prices. It uses interest rates to balance these goals, keeping the economy growing without inflation.
Distinguish the federal funds rate from mortgage and credit-card rates
The federal funds rate is not the same as your home loan or credit card rates. While the central bank’s decisions affect these rates, they also depend on market demand and borrower risk. Think of the federal funds rate as the starting point that affects the financial world.
Read Federal Open Market Committee statements for policy direction
The Federal Open Market Committee (FOMC) decides on monetary policy. After meetings, they release statements on their views. These statements help you know if the Federal Reserve will raise, lower, or keep rates the same.
Step 5: Interpret Consumer Spending and Retail Sales
Household purchases drive the U.S. economy. They make up about two-thirds of the nation’s total output. This shows how well the economy is doing.
Connect consumer spending to the largest part of the U.S. economy
When people shop or pay for services, they help the U.S. economy grow. Consumer spending includes buying food, clothes, and even medical visits. Economists watch these trends to see if people feel confident and financially stable.
Use retail sales to track purchases of goods
Retail sales focus on items bought in stores and online. This shows how much people are buying physical goods. It’s a quick way to see if demand is changing.
Adjust spending data for inflation before judging real growth
Rising prices can make spending look higher even if people buy less. Analysts adjust for inflation to see if spending is really growing. Real growth shows if people are buying more or just paying more for the same things.
Why a strong holiday season may not indicate lasting momentum
The holiday season often boosts shopping, but this doesn’t always mean the economy is strong. Experts look beyond the holidays to see if the trend lasts.
Compare spending trends with household income and consumer confidence
To understand spending, look at income and how people feel. If people feel secure about their jobs and wages, they tend to spend more. The table below shows how these factors affect the market.
| Indicator | Primary Focus | Economic Signal |
|---|---|---|
| Retail Sales | Physical Goods | Short-term demand |
| Consumer Spending | Goods and Services | Long-term growth |
| Household Income | Purchasing Power | Future capacity |
| Consumer Confidence | Sentiment | Spending intent |
Step 6: Examine Housing and Construction Indicators
The housing market is key to the U.S. economy. It shows how people feel about their money future. By watching construction and sales, we see changes in demand and investment.
Read housing starts, building permits, and new-home sales
Housing starts count new homes being built. Building permits show projects ready to start. New-home sales tell us about demand for materials and workers.
Use existing-home sales and inventory to understand housing conditions
Existing-home sales show what’s happening in the real estate world. Inventory levels tell us how many homes are for sale. Low inventory means prices might go up, making it hard for buyers.
- Low inventory often leads to faster price appreciation.
- High inventory may suggest a cooling market or oversupply.
- Sales volume provides a snapshot of current buyer activity.
Track mortgage rates and affordability together
Mortgage rates affect how much homeowners pay each month. When rates go up, it costs more to buy a home. Affordability depends on home prices, interest, and how much people earn.
Why housing data often signals future economic activity
Housing is a big industry that needs a lot of planning and money. Builders’ actions show if they think the economy will grow. Building homes also boosts demand for many things, like furniture and appliances.
| Indicator | What It Measures | Economic Signal |
|---|---|---|
| Housing Starts | New construction projects | Future growth potential |
| Building Permits | Authorized future projects | Builder confidence |
| Existing-Home Sales | Completed resale transactions | Current market liquidity |
Account for regional differences in the U.S. housing market
The U.S. housing market is not the same everywhere. Local things like jobs, people moving, and land affect each area differently. For example, mortgage rates are the same everywhere, but how they affect people varies by area.
Step 7: Understand Business Activity and Manufacturing Data
Understanding the American economy means looking at business performance. By studying manufacturing data, we see the U.S. industrial strength. This helps us know if the economy is growing or slowing.
Learn what the Institute for Supply Management indexes show
The Institute for Supply Management (ISM) surveys purchasing managers. These reports show business activity by looking at production, jobs, and inventory. Since managers make decisions based on real needs, their feedback shows the economy’s future.
Interpret readings above and below the 50-point expansion threshold
The ISM indexes use a scale to measure the economy. A number above 50 means the sector is growing. A number below 50 means it’s shrinking.
Compare manufacturing activity with services activity
The ISM has two reports: one for making things and one for services. Manufacturing deals with physical goods, while services cover healthcare, finance, and more. Comparing these reports shows if growth is wide or narrow.
Use durable-goods orders to evaluate business investment
Durable-goods orders track the buying of things like machines and computers. These orders show business investment. When they go up, it means companies are ready for growth.
Watch new orders, inventories, and supplier delivery times for early signals
New orders are key because they show what will be made next. If inventories go up but new orders go down, it might mean sales issues. Also, longer delivery times can mean high demand or supply chain problems.
| Indicator | Primary Focus | Economic Signal |
|---|---|---|
| ISM Manufacturing | Factory Production | Industrial Health |
| Durable Goods | Capital Investment | Business Confidence |
| Services Index | Consumer/Business Services | Broad Economic Activity |
Step 8: Put Consumer Confidence and Sentiment in Context
Surveys show how people feel about their money. They give us a peek into the national mood. These surveys are about what people think, not what really happens.
Distinguish confidence surveys from measured economic activity
Economic reports use real data like tax money and sales. But economic sentiment comes from what people say. They tell us about their money and the economy.
Identify what households report about jobs, income, and spending
People share their job hopes and income dreams in these surveys. They also talk about big buys like houses. This helps us see what people plan to do before it happens.
Compare expectations with current-condition readings
Surveys ask about now and the future. A big difference might mean big changes coming. It’s like watching for signs of a storm.
Why pessimistic sentiment can coexist with rising consumer spending
Even when people feel down, they might still buy things. They might worry about prices or politics but still spend. They use savings or credit to keep up appearances.
Use sentiment as a supporting indicator rather than a final verdict
Sentiment is useful but not enough on its own. It’s better with real data like GDP. Together, they give a full picture of the economy.
| Indicator Type | Primary Focus | Data Source |
|---|---|---|
| Hard Data | Actual spending and production | Government agencies |
| Sentiment Data | Perceptions and expectations | Survey responses |
| Predictive Value | Reflects past trends | Signals future behavior |
Step 9: Connect Trade, Government Debt, and Financial Markets
Investors look at the big picture. They connect trade, government debt, and financial markets. These help us see how the U.S. works with the world and handles money.
Read imports, exports, and the trade balance
The trade balance shows exports minus imports. A surplus means more exports. A deficit means more imports.
Trade flows are part of the Gross Domestic Product. Changes in these flows show shifts in demand for American goods or foreign products.
Understand how budget deficits and federal debt differ
A budget deficit happens when the government spends more than it makes in a year. Federal debt is the total money borrowed to cover these deficits.
Think of the deficit as a monthly shortcoming. The debt is like the total on a credit card.
Track Treasury yields as signals about growth and inflation expectations
Treasury yields are key for financial markets. They show what investors think about future growth, inflation, and interest rates.
Rising yields mean investors think growth or inflation will be strong. Falling yields suggest a slowdown or a desire for safe bonds.
Distinguish stock-market performance from the health of the overall economy
Many think a rising stock market means a strong economy. But, stock prices reflect future earnings, not current conditions.
The stock market can move against the economy. It shows investor mood but isn’t the only sign of national wealth.
Recognize how global events can influence U.S. indicators
The U.S. economy is connected to the world. Global events, like tensions or supply chain issues, affect U.S. data.
Global events cause price and currency changes. Knowing these connections helps us understand why U.S. data can change suddenly.
Step 10: Build a Simple Economic Indicator Dashboard
Creating a custom dashboard helps you stay up-to-date with the U.S. economy. It keeps you from getting lost in too much news. A good economic indicator dashboard lets you see what really matters for your money.
Choose a small set of indicators for growth, prices, jobs, and rates
You don’t need to follow every government report. Pick a few key economic indicators to understand the big picture. Look at GDP for growth, the Consumer Price Index for prices, the monthly jobs report for jobs, and the federal funds rate for interest rates.
Check release dates from the Bureau of Economic Analysis, Bureau of Labor Statistics, and Federal Reserve
Good data comes from official sources. The Bureau of Economic Analysis (BEA) gives GDP data. The Bureau of Labor Statistics (BLS) tracks inflation and jobs. The Federal Reserve shares important info on interest rates and money policy.
- BEA: Check for quarterly GDP updates.
- BLS: Look for monthly inflation and jobs reports.
- Federal Reserve: Monitor FOMC meeting schedules.
Record the latest figure, previous figure, and longer-term trend
Keep a simple log of your chosen metrics. This lets you see immediate changes. Tracking these numbers over time shows the economy’s direction.
Use revisions and seasonal adjustments responsibly
Government updates their reports as more info comes in. These updates are normal and make the data more accurate. Always check if a number has been adjusted for seasonal patterns. This gives a clearer view of economic indicators than raw data alone.
| Indicator | Source | Frequency |
|---|---|---|
| GDP | BEA | Quarterly |
| CPI | BLS | Monthly |
| Jobs Report | BLS | Monthly |
Create a monthly review routine without reacting to every headline
Being consistent is key to managing your economic indicator dashboard. Set aside time each month to update and review. This keeps you focused on the long-term, not daily market ups and downs.
Step 11: Apply Economic Data to Everyday Financial Decisions
Using economic data in your money plans helps you deal with market changes. National reports might seem far away, but they help with your daily choices. They turn into useful tips to keep your money safe and plan for the future.
Use inflation and wage data when planning a household budget
Inflation reports show how living costs change over time. If prices go up faster than your income, cut back on spending. Watching wage growth helps see if you’re earning enough to keep up with the economy.
Consider interest rates before borrowing or refinancing
Interest rates affect the cost of big loans like mortgages or car loans. Instead of reacting to every news update, look at the big picture. Compare today’s rates to your current debt to see if refinancing could save you money.
Use employment and GDP trends when evaluating job or business decisions
Big numbers like GDP and job rates tell you about your field’s health. A strong job market means better chances for career growth or pay raises. But slow growth might mean you should think twice about starting a new business or changing careers.
Avoid changing a long-term investment plan because of one report
It’s easy to get swayed by a single news headline, but long-term investment success needs steady focus. Market ups and downs are normal, and one report doesn’t justify changing your whole plan. Keep your strategy unless your goals or time frame have really changed.
Match the importance of an indicator to the decision being made
Not all data is equal for your needs. For quick buys, look at inflation and interest rates. For big goals, focus on GDP and job changes to understand the big picture.
Conclusion
Understanding finance is easier when you see data as answers to questions. Tracking GDP, inflation, or jobs helps us see the big picture. Learning about economic indicators takes time and focus on long-term trends.
Smart people don’t just look at monthly numbers. They adjust for seasons and market hopes to make smart choices. By looking at different data, we get a full view of how things affect us every day.
Creating a personal dashboard helps organize these insights. It turns numbers into useful information for planning budgets, careers, and investments. Regularly using these tools helps us make better choices in a changing world.
Begin with a few important metrics that fit your goals. As you get better, economic indicators will guide your financial path. Keep learning and improving to stay on top of things.