
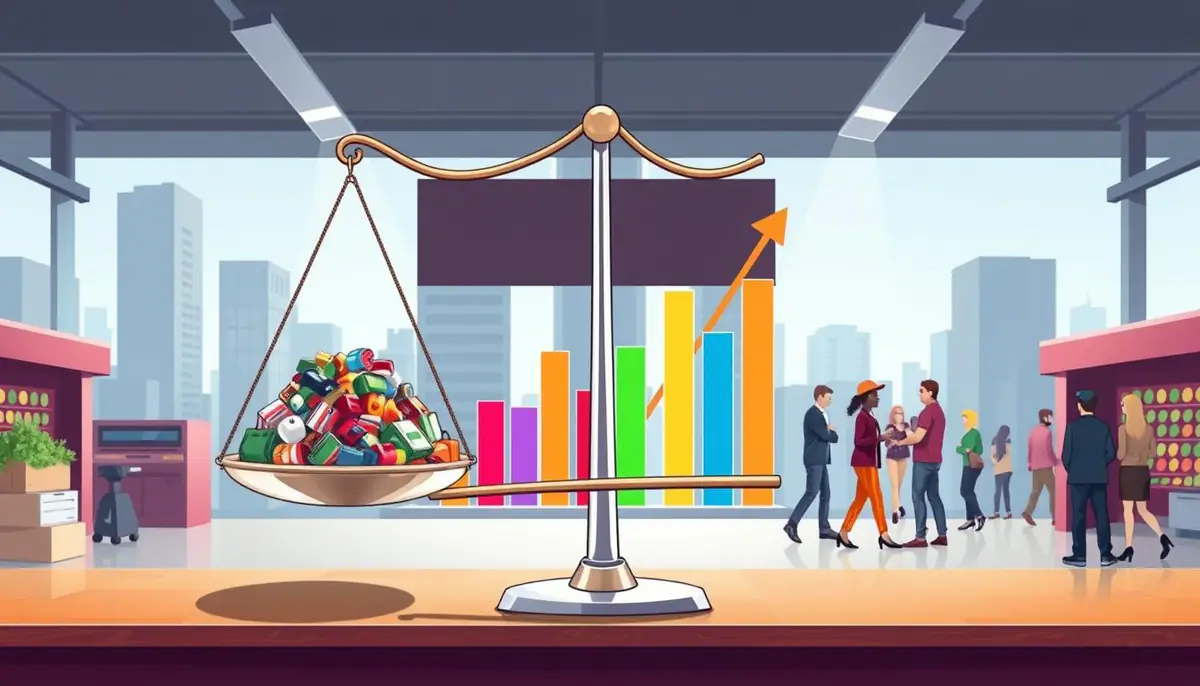
Prices change every day, and it can feel mysterious. But, supply and demand explained makes it clear. It’s a simple way to understand market changes.
This model shows how buyers and sellers make decisions. Their choices affect the prices we pay. When demand goes up, prices usually rise to meet it.
This idea helps us understand prices on things like food, gas, and homes. By watching these changes, we can guess why prices go up or down. It makes financial news easier to understand and affects our money.
This guide starts with basic concepts and goes deeper. You’ll learn about market equilibrium and how price controls work. It’s useful for students and curious shoppers alike. These insights help you feel more confident in the world of commerce.
Define the Two Forces Behind Every Market
Every economic exchange has two key forces. These are supply and demand. They decide how goods and services go from makers to buyers in a free market.
What Demand Means to Buyers
Demand is more than wanting something. It’s about how much buyers can and want to buy at different prices. When prices go up, people often look for cheaper options.
This is the law of demand in action. It shows that as prices go up, people buy less. But when prices drop, they buy more.
What Supply Means to Sellers
Supply is how much producers want to sell. It depends on costs, technology, and how much money they can make. Sellers want to make as much money as they can by adjusting these things.
The law of supply says that when prices are high, sellers make more. But if prices are low, they might make less.
Why Price Connects Both Sides
Price is the link between buyers and sellers. It shows how rare or common a product is. Buyers see if they can afford it, and sellers see if it’s worth their time.
| Feature | Demand Side | Supply Side |
|---|---|---|
| Primary Actor | Consumers | Producers |
| Main Goal | Utility/Satisfaction | Profit Maximization |
| Price Relationship | Inverse (Law of Demand) | Direct (Law of Supply) |
| Market Signal | Affordability | Production Incentive |
Read a Demand Curve and Identify Buyer Behavior
Learning to read a demand curve helps predict how buyers act in changing markets. This graph shows how prices and demand are linked. It slopes down, showing that higher prices mean less buying.
How Price Changes the Quantity Demanded
When a good’s price changes, it moves along the demand curve. This is called a change in quantity demanded. For example, cheaper movie tickets mean more people go to the movies.
Distinguish Demand From Quantity Demanded
It’s important to know the difference between moving along the curve and shifting the whole curve. A price change moves you along the curve. But, external factors can shift the whole curve, showing a big change in what buyers want.
Recognize the Main Demand Shifters
Several things outside the product itself can change the market. These are called demand shifters. They affect how much buyers want at any price.
Income, preferences, population, and expectations
Big changes in the world can affect how much we spend. Here are the main reasons:
- Income: More money means buying more fancy things or eating out more.
- Preferences: New trends or social media can make something more or less popular.
- Population: More people in a place means more interest in products.
- Expectations: Thinking prices will go up soon can make people buy more now.
Prices of substitutes and complementary goods
The prices of similar or related items also matter. If coffee gets too expensive, people might choose tea instead.
Complementary goods work differently. Cheaper gaming consoles mean more people want video games. Knowing these connections helps businesses guess how sales will change based on other prices.
Read a Supply Curve and Identify Seller Behavior
When prices go up, producers want to make more. This is called the law of supply. It means that as prices rise, sellers want to sell more. The supply curve shows this by going up.
How Price Changes the Quantity Supplied
Producers watch prices to decide how much to make. If a product costs more, they can make more money. So, they make more of it.
Distinguish Supply From Quantity Supplied
It’s important to know the difference between supply and quantity supplied. A change in quantity supplied is when price changes. But a change in supply is when the whole curve moves.
If supply goes up, the curve moves to the right. This means sellers offer more at every price. If supply goes down, the curve moves to the left. This means sellers offer less at every price.
Recognize the Main Supply Shifters
Many things can make the whole curve move. These are called supply shifters. They change how things are made, not just the price.
Production costs and available technology
Things like labor and materials affect how much is made. If these costs go down, or if new tech makes things easier, more can be made. This makes the supply curve move to the right.
Taxes, regulations, weather, and seller expectations
Government rules and weather also affect how much is made. Here’s how:
- Taxes and Regulations: More taxes or rules make things costlier. This makes the supply curve move to the left.
- Weather: Bad weather can ruin crops. This makes less available right away.
- Seller Expectations: If sellers think prices will go up, they might not sell as much. This reduces supply today.
Find the Market Equilibrium Price
When buyers and sellers meet, they reach a special state called market equilibrium. This happens when what buyers want to buy equals what sellers want to sell. At this point, a price is found that makes both sides happy.
Locate the Point Where Supply Meets Demand
Imagine a graph with a demand curve that goes down and a supply curve that goes up. Where these curves meet is the equilibrium price. At this spot, the price doesn’t change because the market is perfectly balanced.
Calculate the Equilibrium Quantity From a Simple Table
Looking at a data table helps find this balance. By comparing what buyers want to buy and what sellers want to sell, you find the equilibrium quantity.
| Price per Unit | Quantity Demanded | Quantity Supplied |
|---|---|---|
| $2.00 | 100 | 20 |
| $4.00 | 60 | 60 |
| $6.00 | 20 | 100 |
Use a Market Example With Coffee or Gasoline
Let’s look at the gasoline market. If gas prices are too high, drivers buy less. If prices are too low, there are long lines because too many want to buy.
The market adjusts until it finds the equilibrium price. This ensures the right amount of gas is sold. The same thing happens with coffee, where prices adjust until the shop sells just what it makes.
Check Whether the Market Has Cleared
A market is “cleared” when there’s no leftover goods and no unsatisfied buyers. Look for two signs:
- No surplus: Sellers don’t have too much inventory.
- No shortage: Buyers don’t have to wait for sold-out items.
When these signs are true, the market equilibrium is reached. This is the most efficient state for the economy, assuming no outside rules.
Understand Shortages, Surpluses, and Price Signals
When a product’s price doesn’t match the market, we see shortages and surpluses. These signs tell buyers and sellers what to do. They help the market find balance.
Identify a Shortage When Buyers Want More Than Sellers Offer
A shortage happens when buyers want more than sellers can supply. This can be due to a product’s sudden popularity or higher production costs. Buyers then fight over the limited items.
Identify a Surplus When Sellers Offer More Than Buyers Want
A surplus occurs when sellers have more than buyers want. This leaves extra stock on shelves. To sell it, businesses use discounts or sales.
Follow How Competition Pushes Prices Toward Equilibrium
The market uses price signals to show if there’s too little or too much. In a shortage, prices go up to encourage more making. In a surplus, prices drop to get more buying.
- Shortages mean prices might go up to meet demand.
- Surpluses mean prices might fall to get more buying.
- Competition helps prices find a balance where everyone is happy.
Recognize When Prices Cannot Adjust Quickly
Prices don’t always change fast to fix imbalances. Several things can stop prices from moving:
- Long-term contracts that keep prices the same for a long time.
- Government regulations that set price limits.
- Limited information that keeps buyers or sellers in the dark.
- Slow production cycles that make quick changes hard.
Analyze Demand Shifts Step by Step
Understanding market changes needs a clear process. We look at specific things to see if prices or behavior have changed. This helps us understand why the demand curve moves.
Step One: Decide Whether a Nonprice Factor Changed
First, we check if a change is due to price or something else. If price changes, we move along the curve. But if something else changes, the whole curve shifts.
These other things are called demand shifters. They include income changes, new preferences, or new products. Knowing these is key to understanding market trends.
Step Two: Determine Whether Demand Increased or Decreased
After finding a nonprice factor, we see if demand went up or down. If demand goes up, we move the curve to the right. If it goes down, we move it to the left.
News or trends can affect these choices. If a product gets more popular, demand goes up. If a cheaper substitute comes out, demand for the original might go down.
Step Three: Predict the New Price and Quantity
Knowing the direction of the shift, we can guess the market’s new state. If demand goes up, prices and sales usually rise. If demand goes down, prices and sales fall.
This assumes the supply stays the same. By focusing on demand, we see how consumer choices affect the market.
Apply the Method to Housing, Restaurant Meals, and Streaming Services
Markets like housing, dining, and streaming show these shifts well. For example, more people in an area means more housing demand and higher prices. A hit show on streaming can also increase subscriptions.
Restaurant demand can change with income or health trends. The table below shows how these changes affect markets.
| Factor Change | Shift Direction | Price Impact | Quantity Impact |
|---|---|---|---|
| Increased Income | Right | Increase | Increase |
| Lower Substitute Price | Left | Decrease | Decrease |
| Higher Popularity | Right | Increase | Increase |
| Negative Expectations | Left | Decrease | Decrease |
Analyze Supply Shifts Step by Step
When production changes, the supply curve moves, affecting buyers and sellers. A simple method helps track how changes in production affect goods and services.
Step One: Identify the Change in Production Conditions
First, look for supply shifters that change production costs or ability. These can be new technology, raw material prices, or government rules.
- Technological breakthroughs that improve efficiency.
- Fluctuations in the cost of labor or energy.
- Natural events like droughts or storms affecting harvests.
- New taxes or subsidies impacting production costs.
Step Two: Determine Whether Supply Increased or Decreased
After finding the cause, decide if it makes production easier or harder. If it’s easier, more is offered at every price, moving the curve right.
If it’s harder, less is offered, moving the curve left. This is different from price changes alone.
Step Three: Predict the New Price and Quantity
Next, see how the shift affects demand. With more supply, prices drop and more is sold.
With less supply, prices go up and less is sold. Here’s what happens in general:
| Shift Direction | Price Effect | Quantity Effect |
|---|---|---|
| Supply Increase | Price Decreases | Quantity Increases |
| Supply Decrease | Price Increases | Quantity Decreases |
Apply the Method to Produce, Electronics, and Air Travel
Examples show how supply shifters work in various fields. For example, a big strawberry crop lowers prices.
In electronics, new tech makes gadgets cheaper. But in air travel, higher fuel costs mean fewer flights and higher prices.
Explain Price Elasticity Without Getting Lost in Math
Price sensitivity shows how people react to price changes. This idea, called price elasticity, shows how much people buy when prices go up or down. It helps us see why some markets stay the same while others change a lot.
Compare Elastic and Inelastic Demand
When prices go up, some markets get very sensitive. This is called elastic demand. A small price increase can make people buy much less. On the other hand, if prices go up and people still buy the same amount, it’s inelastic demand.
- Elastic Demand: Luxury items or goods with many alternatives.
- Inelastic Demand: Essential goods like life-saving medicine or basic utilities.
See How Substitutes and Necessities Affect Responsiveness
Many things affect how sensitive a product is to price changes. Having many substitutes is key. If there are lots of options, people might stop buying when prices go up.
Necessities also matter a lot. People need to buy certain things no matter the cost. This keeps demand steady. Here’s a table showing how different things affect market sensitivity.
| Factor | High Responsiveness | Low Responsiveness |
|---|---|---|
| Substitutes | Many available | Few or none |
| Necessity | Luxury item | Essential good |
| Timeframe | Long term | Short term |
Use the Percentage-Change Formula for a Basic Estimate
Economists use a simple ratio to figure out responsiveness. They divide the change in quantity demanded by the change in price. This gives a number that shows how much buyers care about price changes.
If the number is over one, demand is elastic. If it’s under one, demand is inelastic. This math helps businesses guess how sales might change after a price change.
Connect Elasticity to Business Revenue and Household Costs
Understanding these patterns is crucial for businesses and families. For companies, knowing if demand is elastic helps decide on pricing. If demand is elastic, raising prices might not increase revenue because too many customers leave.
For families, knowing these patterns helps with budgeting. Families often can’t control spending on things like gasoline or heating oil. By knowing which expenses are flexible, families can better handle rising prices.
Separate Market Changes From Price-Control Policies
Prices are usually set by supply and demand. But, sometimes, the government steps in with price controls. These rules can change how the market works, leading to different economic results.
Explain What a Price Ceiling Does
A price ceiling is the highest price sellers can charge. If the government sets it too low, the market can’t clear. This is meant to keep prices low for buyers.
Use rent control as a shortage example
Rent control is a price ceiling in many cities. It limits how much landlords can charge. But, it can cause a shortage because there’s more demand than supply at that price.
Explain What a Price Floor Does
A price floor is the lowest price sellers must get. If it’s too high, the market can’t adjust. This policy helps ensure producers or workers get a certain income.
Use minimum wage policy as a labor-market example
Minimum wage is a price floor in the labor market. It sets a legal minimum pay. If it’s too high, it can lead to surplus of labor, or unemployment.
Evaluate Tradeoffs for Buyers, Sellers, and Workers
Every policy change affects consumer surplus and producer surplus. Consumer surplus is the benefit buyers get from paying less. Producer surplus is the benefit sellers get from getting more.
Controls can help some but hurt others. Some people might pay less or earn more, but others might find things harder to get or have fewer jobs. Policymakers need to think carefully about these tradeoffs.
| Policy Type | Market Impact | Primary Result | Economic Effect |
|---|---|---|---|
| Price Ceiling | Below Equilibrium | Shortage | Reduces supply |
| Price Floor | Above Equilibrium | Surplus | Reduces demand |
| Market Equilibrium | Natural Balance | Clearing | Optimizes surplus |
Apply Supply and Demand to Everyday Price Changes
Every time you see a price tag change at the store, it’s supply and demand at work. These price signals tell us a lot about how goods move in the economy. By watching these changes, you can understand why prices go up and down in your area.
Trace Why Gas Prices Rise After a Supply Disruption
When a refinery shuts down or a pipeline gets blocked, the market faces a supply problem. This is a big supply shifter, moving the supply curve to the left. With less fuel and the same need, prices go up.
Explain Why Seasonal Produce Prices Move
Fruits and veggies prices change a lot through the year. In peak harvest months, more crops are available, making prices lower. But when the season ends, prices go up until the next harvest.
Analyze How Interest Rates Affect Home Demand
Interest rates are big demand shifters in the housing market. Lower rates make borrowing cheaper, encouraging more people to buy homes. This pushes the demand curve to the right, often raising home prices.
Use a Practical Checklist to Interpret News About Prices
Understanding economic news is easier with a simple checklist. This method helps you focus on what really matters in the market. It ensures you grasp the real reasons behind economic shifts.
Ask what changed, who was affected, and which curve moved
First, identify the event in the news. Then, see if it affects producers or consumers. Finally, figure out if it shifts the supply or demand curve.
Check whether the change affects price, quantity, or both
After identifying the shift, look at the new equilibrium. A shift in one curve usually changes the price and quantity sold. Tracking these variables helps predict market outcomes after disruptions.
| Market Event | Primary Driver | Price Impact |
|---|---|---|
| Fuel Shortage | Supply Shift | Increase |
| Lower Interest Rates | Demand Shift | Increase |
| Peak Harvest | Supply Shift | Decrease |
Conclusion
Learning about supply and demand helps us understand the world better. Prices tell us what buyers want and what sellers can offer. Every deal shows a balance between these two sides.
Now, you know how to tell if prices change because of demand or supply. Things like income, new tech, and what people like can shift the market. Knowing this helps guess how prices might go up or down for things like iPhones or food.
The goal is to find market equilibrium for a healthy economy. When supply and demand match, everything works well. Shortages and surpluses help guide us to make better choices.
Using these economic ideas makes news easier to follow. Keep a checklist to track price changes in your life. Knowing these basics helps you make smart choices in the market.